Top 10 Fertilizer Companies Worldwide for Global Buyers
Choosing a reliable fertilizer company is not simply a matter of comparing annual production or global brand recognition. For agricultural buyers, the decision affects crop yields, soil health, operating costs, and supply continuity. A shipment arriving late can matter as much as its chemical specification.
This guide examines ten leading fertilizer companies worldwide from a global buyer’s perspective. It considers product portfolios, manufacturing scale, regional availability, logistics performance, quality systems, sustainability efforts, and customer support. Key products include nitrogen fertilizers, phosphate fertilizers, potash, and specialty blends. The review also recognizes that buyer priorities differ. A large farm may value bulk delivery, while a distributor may need flexible packaging and dependable documentation.
Industry experience adds useful context. Svein Tore Holsether, President and CEO of Yara International, has said, “Food security is the biggest challenge of our time.” His statement reflects the wider responsibility carried by every fertilizer company. These businesses do more than sell agricultural inputs. They influence how efficiently nutrients reach farms and how responsibly those nutrients are managed.
Still, no ranking can fit every market perfectly. Prices change with energy costs, trade conditions, freight capacity, and seasonal demand. Local regulations also shape purchasing decisions. Buyers should verify certifications, nutrient analysis, delivery terms, and after-sales support before signing contracts. That step is easy to overlook.
A strong supplier on paper may not be the best operational partner. This overview offers a practical starting point, not a substitute for technical due diligence. It also leaves room for debate, because “top” depends on the buyer’s location, crop, budget, and risk tolerance.
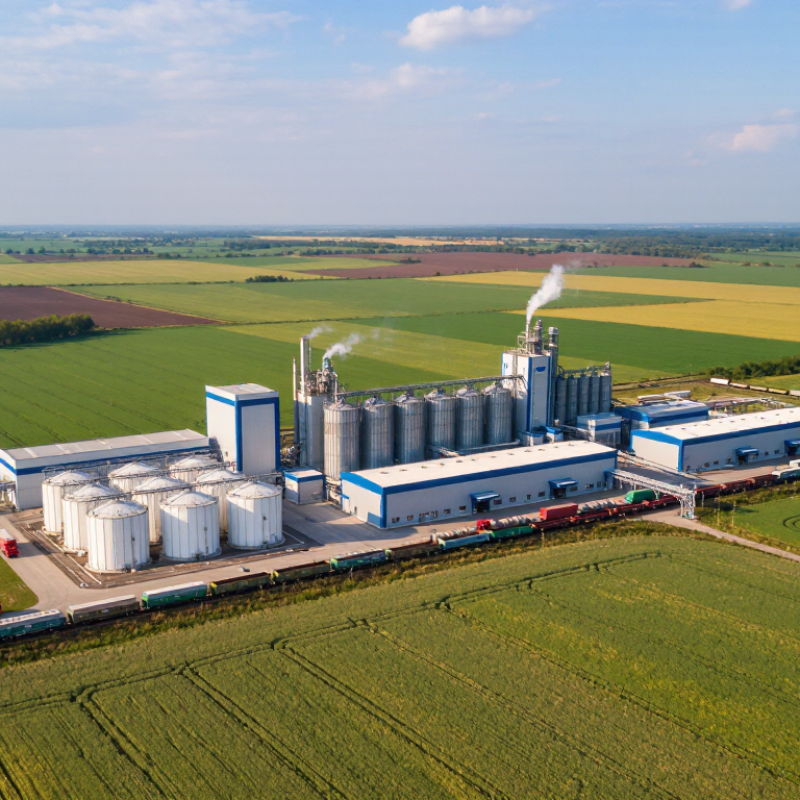
Fertilizer Industry Scope and Global Market Context
Fertilizer Industry Scope and Global Market Context
The global fertilizer industry supports crop yields, soil nutrition, and food security across nearly every farming region. Nitrogen, phosphate, and potash remain its core nutrient segments. The International Fertilizer Association’s 2024 outlook estimated global fertilizer demand could exceed 200 million tonnes of nutrients annually during the mid-2020s. Demand is strongest where population growth and crop intensification overlap. However, supply remains uneven. Natural gas costs affect nitrogen production, while mining capacity and shipping routes influence phosphate and potash availability.
Global buyers should examine more than production volume when comparing major fertilizer companies. The OECD-FAO Agricultural Outlook 2024–2033 links future fertilizer demand with expanding crop output, changing diets, and improved nutrient efficiency. Meanwhile, World Bank commodity data shows that fertilizer prices can move sharply after energy shocks or trade disruptions. A low quoted price may not remain low after freight, insurance, port handling, and currency changes. Forecasts are useful, but they are not promises. A spreadsheet can still miss a port delay.
Tips: Ask for recent laboratory specifications, nutrient consistency, safety documentation, and delivery records. Compare prices on the same basis, such as delivered cost per nutrient tonne. Check whether suppliers can support local soil conditions. Independent agronomic advice is valuable, especially for blended products. Buyers should also review responsible sourcing policies and emissions reporting. These details may appear minor, yet they often shape long-term reliability.
Top 10 Fertilizer Companies Worldwide for Global Buyers
Global Fertilizer Industry Scope and Market Context
Global fertilizer demand is concentrated in nitrogen, phosphate, and potash nutrients. Nitrogen represents the largest demand segment, while phosphate and potash remain essential for crop quality, root development, and yield improvement. These nutrient categories define the core market opportunity for international fertilizer buyers and suppliers.
Data shown in million tonnes of nutrient, based on global fertilizer demand estimates reported by the International Fertilizer Association and FAOSTAT agricultural statistics.
Profiles of the World’s Leading Fertilizer Producers
Top 10 Fertilizer Companies Worldwide for Global Buyers
The world’s leading fertilizer producers differ in resources, technology, and regional reach. A reliable profile should examine production capacity, product consistency, and shipping performance. Nitrogen producers often depend on natural gas and operate large ammonia plants. Phosphate producers usually control mineral reserves, processing facilities, and export terminals. Potash producers rely on underground mining, refining, and stable rail connections.
Other major producers focus on blended fertilizers, specialty nutrients, or integrated supply chains. Some operate near large farming regions, reducing delivery times and storage costs. Others serve distant markets through deep-water ports and long-term logistics contracts. Buyers should also review safety records, laboratory testing, and environmental reporting. These details matter when every shipment must match a field plan. However, capacity figures can be difficult to compare. Companies may report annual potential, while actual output changes with maintenance, energy prices, or weather.
Tips: Ask for recent certificates of analysis, delivery records, and clear packaging specifications. Check whether quoted capacity reflects current production. Request samples when crop sensitivity is high. A practical review may reveal small weaknesses, such as slow responses or inconsistent granule size. That is not always a deal-breaker, but it deserves attention. Procurement decisions should balance price, nutrient value, supply reliability, and local agronomic advice.
Top 10 Fertilizer Companies Worldwide for Global Buyers - Profiles of the World’s Leading Fertilizer Producers
| Position |
Anonymous Producer Profile |
Primary Operating Region |
Approx. Annual Fertilizer Capacity
(million metric tonnes) |
2023 Reported Revenue
(approx. USD billion) |
Main Nutrient Categories |
Key Global-Buyer Strength |
| 1 |
Producer Profile 01 |
North America |
23–25 |
29.1 |
Potash, nitrogen, phosphate |
Integrated mining, production, distribution, and retail coverage |
| 2 |
Producer Profile 02 |
North Africa |
15–18 |
9.4 |
Phosphate rock, phosphoric acid, phosphate fertilizers |
Large phosphate reserves and broad export reach |
| 3 |
Producer Profile 03 |
United States |
12–14 |
6.6 |
Ammonia, urea, ammonium nitrate, nitrogen solutions |
High-scale nitrogen manufacturing and inland logistics |
| 4 |
Producer Profile 04 |
Western Europe |
13–15 |
16.8 |
Ammonia, nitrates, urea, compound fertilizers |
Strong European distribution and lower-carbon fertilizer initiatives |
| 5 |
Producer Profile 05 |
North America |
18–20 |
13.7 |
Potash, phosphate, ammonia, finished fertilizers |
Balanced phosphate and potash portfolio with international terminals |
| 6 |
Producer Profile 06 |
Central and Eastern Europe |
20–24 |
6.7 |
Potash, nitrogen, phosphate, complex fertilizers |
Vertically integrated mines and chemical production assets |
| 7 |
Producer Profile 07 |
Eastern Europe |
12–14 |
Not separately disclosed |
Potash and potassium chloride |
Major single-nutrient potash scale and export specialization |
| 8 |
Producer Profile 08 |
Middle East and Europe |
22–25 |
6.9 |
Potash, ammonia, urea, phosphate fertilizers |
Broad international manufacturing footprint and product diversity |
| 9 |
Producer Profile 09 |
Southeast Asia |
8–10 |
7.5 |
Potash, phosphate, specialty fertilizers |
Integrated mineral resources and specialty crop-nutrition products |
| 10 |
Producer Profile 10 |
Central Asia |
10–12 |
Not separately disclosed |
Potash and potassium chloride |
Large-scale potash production with rail and port export connectivity |
|
Data note: Capacity figures are rounded ranges based on publicly disclosed operating and nameplate capacities. Revenue figures refer primarily to FY2023 company-wide reported revenue and are shown in approximate U.S. dollars; fertilizer-only revenue was not consistently disclosed. Rankings reflect a combined view of production scale, resource access, product breadth, and international supply capability rather than a single financial metric.
|
Product Portfolios, Production Capacity, and Regional Reach
Top 10 Fertilizer Companies Worldwide for Global Buyers
For global buyers, the leading fertilizer suppliers differ in product depth, output, and regional access. Their portfolios may include urea, ammonium nitrate, phosphate fertilizers, potash, and blended NPK grades. A broad portfolio helps importers match soil tests, crop cycles, and local application rules. It also reduces dependence on one nutrient.
Production capacity deserves careful review.
Large producers often operate several plants, integrated gas or mineral supply chains, and dedicated storage terminals. Some facilities can produce millions of tonnes annually, while smaller regional plants focus on customized blends. Capacity figures are not perfectly comparable. Reported nameplate output may exceed practical production during maintenance, energy shortages, or weak demand. Buyers should request recent operating rates, plant locations, and shipment records.
Regional reach is equally important. Suppliers with ports, rail links, inland warehouses, and local distribution partners can shorten delivery times. A shipment arriving near a farming zone may cost less than a cheaper product traveling thousands of kilometers inland. Check packaging options, technical documentation, quality certificates, and support in the destination language. Supply security still needs scrutiny. A company may appear global but rely heavily on one plant or one export corridor. That weakness can become visible during a crisis. Price comparisons also need caution, because freight, insurance, storage, and seasonal surcharges can change the final landed cost.
Key Considerations for Global Fertilizer Buyers
Top 10 Fertilizer Companies Worldwide for Global Buyers
Key Considerations for Global Fertilizer Buyers
Comparing the top ten fertilizer companies requires more than checking production volume. Global buyers should examine product consistency, nutrient analysis, and supply reliability. A fertilizer may look affordable, yet freight, insurance, duties, and port charges can change the final cost. Request recent laboratory reports, safety documents, and batch specifications before placing a large order. Independent testing is wise, especially when purchasing unfamiliar formulations.
Tips: Match the nutrient profile to local soil tests and crop needs. Confirm granule size, moisture limits, packaging strength, and shelf life. Ask about traceability from production to shipment. Check whether the supplier can meet your destination’s labeling and registration requirements. Also, review payment terms, delivery windows, and procedures for damaged cargo. Small details matter.
A professional supplier should explain quality controls clearly, not hide behind impressive capacity figures. Buyers should compare at least three written quotations using the same delivery terms. Speaking with existing agricultural distributors can reveal delays that brochures never mention. Sustainability claims also need evidence, such as measurable emissions data or responsible raw-material sourcing. Still, no supplier is perfect. Forecasts fail, vessels are delayed, and specifications can be misunderstood. I would include flexible contract clauses and keep a backup supply plan. That extra caution may feel unnecessary until the first shipment arrives late.